Con las últimas versiones de PHP 7.4 se ha cambiado de versión también en Xdebug, ahora las últimas versiones de php 7.4 y 8.x tiene Xdebug 3.x, y trae varios cambios respecto a la versión 2.x, vamos a ver como configurar el contenedor de Wodby 4 Drupal y el editor VSCode para poder depurar nuestro código.
Lo primero, en el archivo docker-compose.override.yml vamos a descomentar las siguientes opciones:
  php:
    environment:
#      SSH_AUTH_SOCK: /ssh-agent
#      # Read instructions at https://wodby.com/docs/stacks/php/local/#xdebug
      PHP_XDEBUG: 1
      PHP_XDEBUG_MODE: debug
#      PHP_IDE_CONFIG: serverName=my-ide
#      PHP_XDEBUG_IDEKEY: "my-ide"
#      PHP_XDEBUG_CLIENT_HOST: host.docker.internal # Docker 18.03+ Mac/Win
      PHP_XDEBUG_CLIENT_HOST: 172.17.0.1 # Linux
#      PHP_XDEBUG_CLIENT_HOST: 10.254.254.254 # macOS, Docker < 18.03
#      PHP_XDEBUG_CLIENT_HOST: 10.0.75.1 # Windows, Docker < 18.03
#      PHP_XDEBUG_LOG: /tmp/php-xdebug.log
      PHP_XDEBUG_REMOTE_AUTOSTART: 1
      PHP_XDEBUG_DEFAULT_ENABLE: 1
      PHP_XDEBUG_REMOTE_CONNECT_BACK: 0
Tenemos que regenerar el contenidor ejecutando:
docker-compose up --build
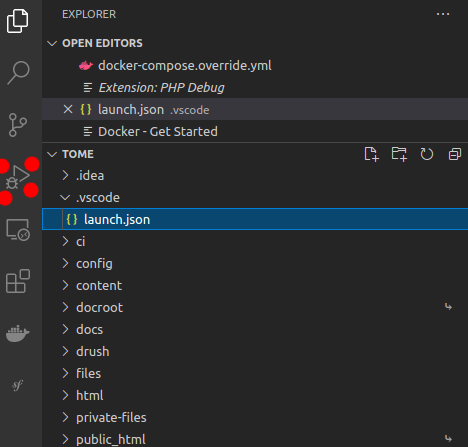
Una vez configurado el contenedor tenemos que instalar el plugin de Xdebug para VScode, existen varios plugins de Xdebug para VSCode, yo he instado el creado por Felix Becker, tiene más de 4 millones de descargas, al instalarlo aparece en la barra de iconos de VSCode de la izquierda el icono de play/triangulo y un escarabajo..
Al pinchar en el icono de Xdebug muestra el siguiente texto:
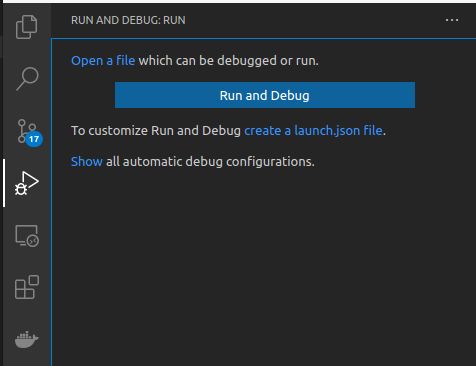
Pincha en el enlace create a launch.json file, del listado de opciones del desplegable que se muestra seleccionamos PHP, y nos creará un archivo con el siguiente texto:
{
    // Use IntelliSense to learn about possible attributes.
    // Hover to view descriptions of existing attributes.
    // For more information, visit: https://go.microsoft.com/fwlink/?linkid=830387
    "version": "0.2.0",
    "configurations": [
        {
            "name": "Listen for Xdebug",
            "type": "php",
            "request": "launch",
            "port": 9000
        },
        {
            "name": "Launch currently open script",
            "type": "php",
            "request": "launch",
            "program": "${file}",
            "cwd": "${fileDirname}",
            "port": 9000
        }
    ]
}
Lo cambiamos por:
{
    // Use IntelliSense to learn about possible attributes.
    // Hover to view descriptions of existing attributes.
    // For more information, visit: https://go.microsoft.com/fwlink/?linkid=830387
    "version": "0.2.0",
    "configurations": [
        {

            "name": "Tome",
            "type": "php",
            "request": "launch",
            "port": 9003,

            "pathMappings": {
                "/var/www/html": "${workspaceRoot}"
            }
        }
    ]
}
- Name: es el nombre que identifica la configuración.
- Port: 9003 es el nuevo puerto de Xdebug.
- PathMappings: es la ruta de la aplicación dentro del contenedor y en la máquina host.
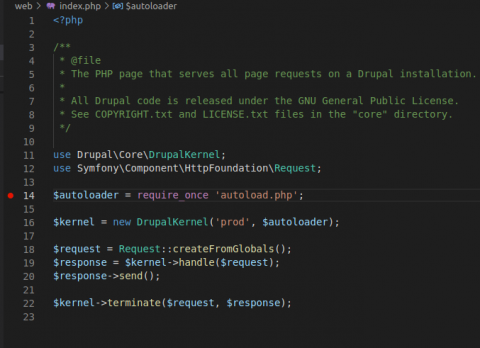
Ahora simplemente hay que indicar el breakpoint en el código y al ejecutar la aplicación si pasa por el breakpoint señalado se parará la ejecución de la petición.